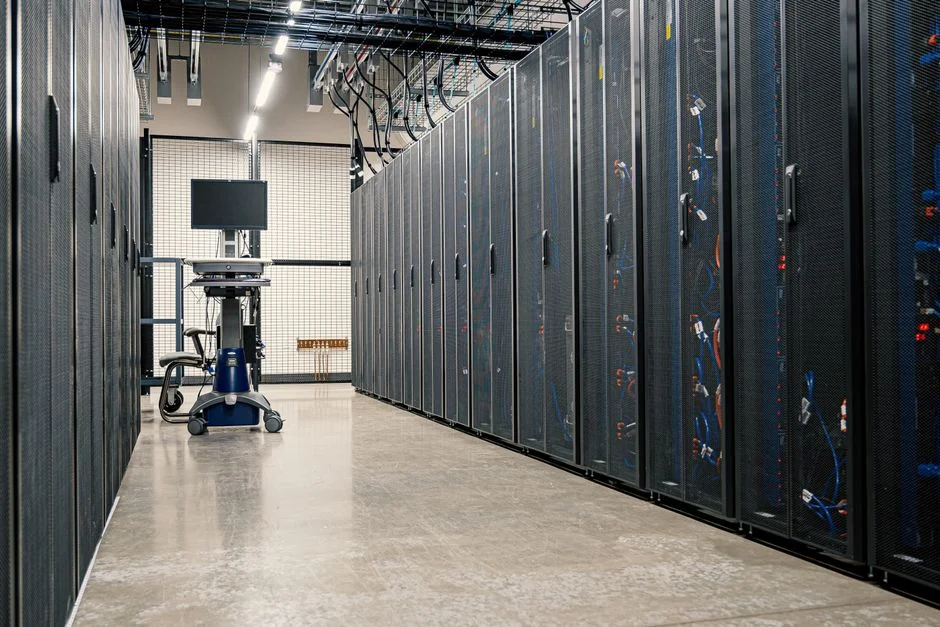
The market regime shift is defined by the convergence of AI infrastructure revenue per gigawatt and data center deployment velocity. Revenue per gigawatt in AI data centers rose from $18 billion with Hopper to $40 billion with Vera Rubin. This increase reflects a direct expansion of revenue per installed unit, not just volume growth.
Nvidia’s second-quarter revenue exceeded $96.2 billion, more than doubling year-over-year. This performance is tied to the Vera Rubin platform, which enables higher compute density per data center. The platform’s adoption is accelerating as hyperscalers deploy new AI workloads with tighter latency requirements.
The T-REX 2X Long NVIDIA Daily Target ETF maintains a 250% total return over 2.5 years. This performance stems from daily exposure to NVDA via swap agreements, which are driven by sustained demand and limited supply in AI chip deployment. Swap spreads remain stable, indicating consistent pricing power.
Baker Tilly Wealth Management increased its NVDA holdings by 7.4% in Q2, acquiring 4,958 shares. This action reflects institutional confidence in the company’s ability to capture margin expansion from per-unit revenue growth. The purchase occurred after Nvidia reported a revenue beat and raised fiscal year guidance, reinforcing the signal of demand resilience.
The result is a structural reallocation of data center capex toward Nvidia’s hardware. As AI workloads grow, deployment velocity rises. Each new data center installation now requires a Vera Rubin-based system, reducing the number of alternatives. This creates pricing power, enabling margin expansion despite broader industry competition.
The shift is not driven by speculative sentiment or software dominance. It is anchored in the physical deployment of higher-value AI infrastructure. As each gigawatt of data center capacity delivers $40 billion in revenue, the cost of entry for alternative hardware increases. This mechanism ensures that revenue per unit grows with deployment, not just with volume.
NVIDIA Corporation’s pricing power is now tied to per-unit revenue growth, not just market share. This creates a self-reinforcing cycle: higher revenue per gigawatt drives more deployments, which in turn drives further revenue per unit. The company’s margin profile stabilizes under this regime, with free cash flow falling 56% sequentially due to receivables growth—yet the underlying revenue per unit continues to rise.